Cap Setting
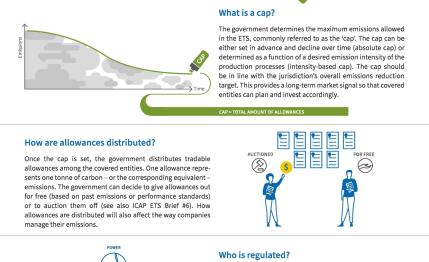
The cap represents the upper limit of GHG emissions allowed in a scheme, or in other words the total number (emissions budget) of allowances that is available to covered entities. When defining a cap, regulators seek to reconcile environmental targets with their economic feasibility.
![]() |
Source: ICAP ETS Brief #1 What is Emissions Trading |
A fixed sum of emissions or an absolute cap ensures that emissions will not exceed a given limit, and therefore delivers a specific environmental outcome. Allowance price levels are a function of how many allowances are available under the cap, how easy it is for installations to reduce emissions, and other factors such as the weather and economic growth. Together these variables need to be taken into consideration when defining a cap. Though the carbon price also depends on these other factors, a generous emissions budget will tend to lead to the market being long and a low allowance price, making it cheap for covered entities to comply. By contrast, a relatively strict emissions budget or ‘tight cap’ means a more limited supply of allowances, or the market being short, resulting in a higher allowance price and a greater fiscal incentive to reduce emissions.
Setting a cap also implies choosing a baseline against which emissions are to be reduced. The cap is usually set in relation to historical emissions, often referred to as a base year, or projected future emissions (e.g. against a business-as-usual scenario). Clear communication of the trajectory, or the path from the basis to the target, helps capped entities plan investment to reduce emissions.
Overall GHG emissions (excluding LULUCF) |
---|
Canada - Nova Scotia |
---|
Emissions: 15.9 MtCO2e MtC02e (2017)
|
Canada - Québec Cap-and-Trade System |
Emissions: 78.7 MtC02e (2017)
|
China - Beijing pilot ETS |
Emissions: 188.1 MtC02e (2012)
|
China - Chongqing pilot ETS |
Emissions: ~300 MtCO2e MtC02e (2018)
|
China - Fujian pilot ETS |
Emissions: 240.0 MtCO2e MtC02e (2014)
|
China - Guangdong pilot ETS |
Emissions: 610.5 MtC02e (2012)
|
China - Hubei pilot ETS |
Emissions: 463.1 MtC02e (2012)
|
China - Shanghai pilot ETS |
Emissions: 297.7 MtC02e (2012)
|
China - Shenzhen pilot ETS |
Emissions: 83.45 MtC02e (2010)
|
China - Tianjin pilot ETS |
Emissions: 215 MtC02e (2012)
|
China National ETS |
Emissions: 10,976 MtC02e (2012)
|
EU Emissions Trading System (EU ETS) |
Emissions: 4,323 MtC02e (2017)
|
Japan - Saitama Target Setting Emissions Trading System |
Emissions: 36.6 MtC02e (2016)
*The overall emissions figure for Saitama is higher than the total of the emissions by sector because the former includes all GHGs in Saitama, whereas the emissions by sector only measures CO2 emissions. |
Japan - Tokyo Cap-and-Trade Program |
Emissions: 64.8 MtC02e (2017)
|
Kazakhstan Emissions Trading Scheme |
Emissions: 353.2 MtC02e (2017)
|
Korea Emissions Trading Scheme |
Emissions: 709.1 MtC02e (2017)
|
Mexico |
Emissions: 733.8 MtC02e (2017)
|
New Zealand Emissions Trading Scheme |
Emissions: 81.0 MtC02e (2017)
|
Swiss ETS |
Emissions: 47.2 MtC02e (2017)
|
USA - California Cap-and-Trade Program |
Emissions: 424 MtC02e (2017)
|
USA - Massachusetts Limits on Emissions from Electricity Generators |
Emissions: 73.3 MtC02e (2017)
|
USA - Regional Greenhouse Gas Initiative (RGGI) |
Emissions: 463.6 MtC02e (2014)
|
Colombia |
Emissions: 237 MtC02e (2014)
|
German National Emissions Trading System |
Emissions: 906.6 MtC02e (2017)
|
Montenegro |
Emissions: 3.49 MtCO2 MtC02e (2015)
|
Ukraine |
Emissions: 320.6 MtC02e (2017)
|
USA - Pennsylvania |
Emissions: 264.4 MtC02e (2016)
|
USA - Transportation and Climate Initiative (TCI) |
Emissions: 1034.8 MtC02e (2014)
|
USA - Virginia |
Emissions: 136 MtC02e (2017)
|
Brazil |
Emissions: 1,036.3 MtCO2e MtC02e (2015)
|
Chile |
Emissions: 111.7 MtC02e (2016)
|
Indonesia |
Emissions: 1457 MtC02e (2016)
|
Japan |
Emissions: 1291.7 MtC02e (2017)
|
Pakistan |
Emissions: 394.7 MtC02e (2015)
|
Philippines |
Emissions: 210 MtC02e (2016)
|
Taiwan, China |
Emissions: 293.1 MtC02e (2016)
|
Thailand |
Emissions: 318.7 MtC02e (2013)
|
Turkey |
Emissions: 526.3 MtC02e (2017)
|
United Kingdom |
Emissions: 461.7 MtC02e (2018)
|
USA - New Mexico |
Emissions: 66.7 MtC02e (2018)
|
USA - New York City |
Emissions: 50.7 MtC02e (2017)
|
USA - North Carolina |
Emissions: 150.1 MtC02e (2017)
|
USA - Oregon |
Emissions: 62.0 MtC02e (2016)
|
USA - Washington |
Emissions: 97.4 MtC02e (2017)
|
Vietnam |
Emissions: 321.5 MtC02e (2014)
|
Studies
Gilbert, A., Blinde, P., Lam, L., Blyth, W. (2014): Cap-Setting, Price Uncertainty and Investment Decisions in Emissions Trading Systems. Ecofys and Oxford Energy Associates.
Wing, S., Ellerman, A.D., Song, J. (2009): Absolute vs. Intensity Limits for CO2 Emission Control: Performance under Uncertainty. Published in: H. Tulkens & R. Guesnerie (eds.) Design of Climate Policy. Cambridge, MA: MIT Press.
Diekman, J. (2013): EU Emissions Trading: The Need for Cap Adjustment in Response to External Shocks and Unexpected Developments? On behalf of the German Federal Environment Agency.
Official Websites and Presentations
Australia
Climate Change Authority - Cap and Targets Review Issues Paper (April 2013)
EU ETS
European Commission Website - Cap
California
Information on the cap-setting work
Québec
Determination of annual caps on greenhouse gas emissions relating to the cap-and-trade system for greenhouse gas emission allowances for the 2013-2020 period - Order of council (2012-12-12)
RGGI
Official website on the RGGI CO2 Cap
Switzerland
Website of the Federal Office for the Environment on ETS caps and reduction path